
Overview
For our third project in the Iron Hack UX/UI Design Bootcamp, we had to create a dashboard for a wellness app to explore the intricacies of data visualization.
We chose to focus on the correlation between the menstrual cycle and mood swings.
Scope
We had 2 weeks for this project to do user research, competitive analysis, product development and prototyping.
We were expected to deliver the dashboard screen alongside one user flow that illustrated how to input and use the data.
Partner in crime
I-Ling Shih
My role
Although we were all equally involved in the design thinking process and product development, I took the lead in the design implementation.
Understanding the relation between Mood and Period
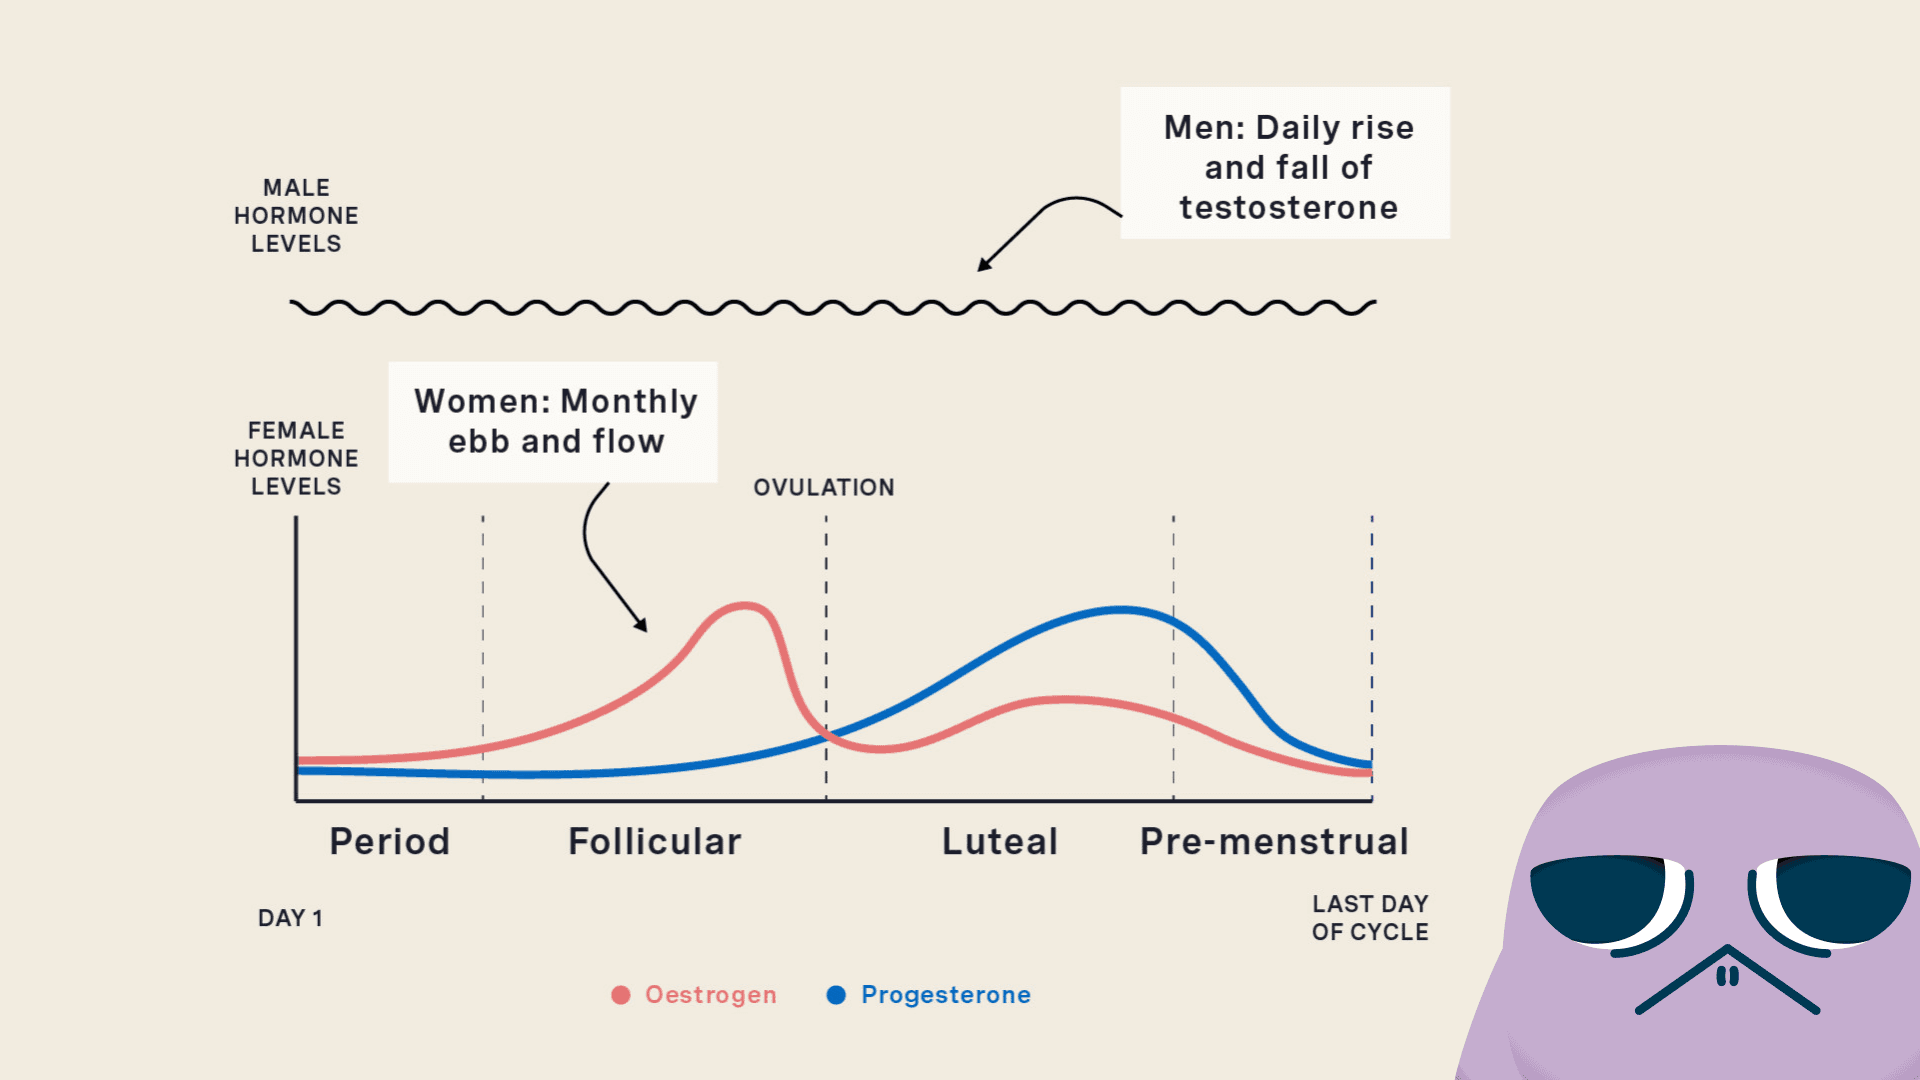
Designing a mood and period tracking app began with a simple but crucial observation: not all bodies follow the same biological rhythm.
Male bodies operate on a predictable 24-hour testosterone cycle.
Female bodies move through a 28–29-day pattern of shifting oestrogen and progesterone levels.
Yet most products, systems, and even definitions of normal are built around the male cycle, leaving many people with hormonal cycles underserved or misunderstood.
We wanted to challenge that by focusing on how hormonal changes influence mood and well-being and creating a tool that feels supportive and compassionate.
Understanding these fluctuations helps users navigate their monthly rhythm with more clarity and kindness.
User research
We surveyed users better to understand their experiences with mood during their menstrual cycle.
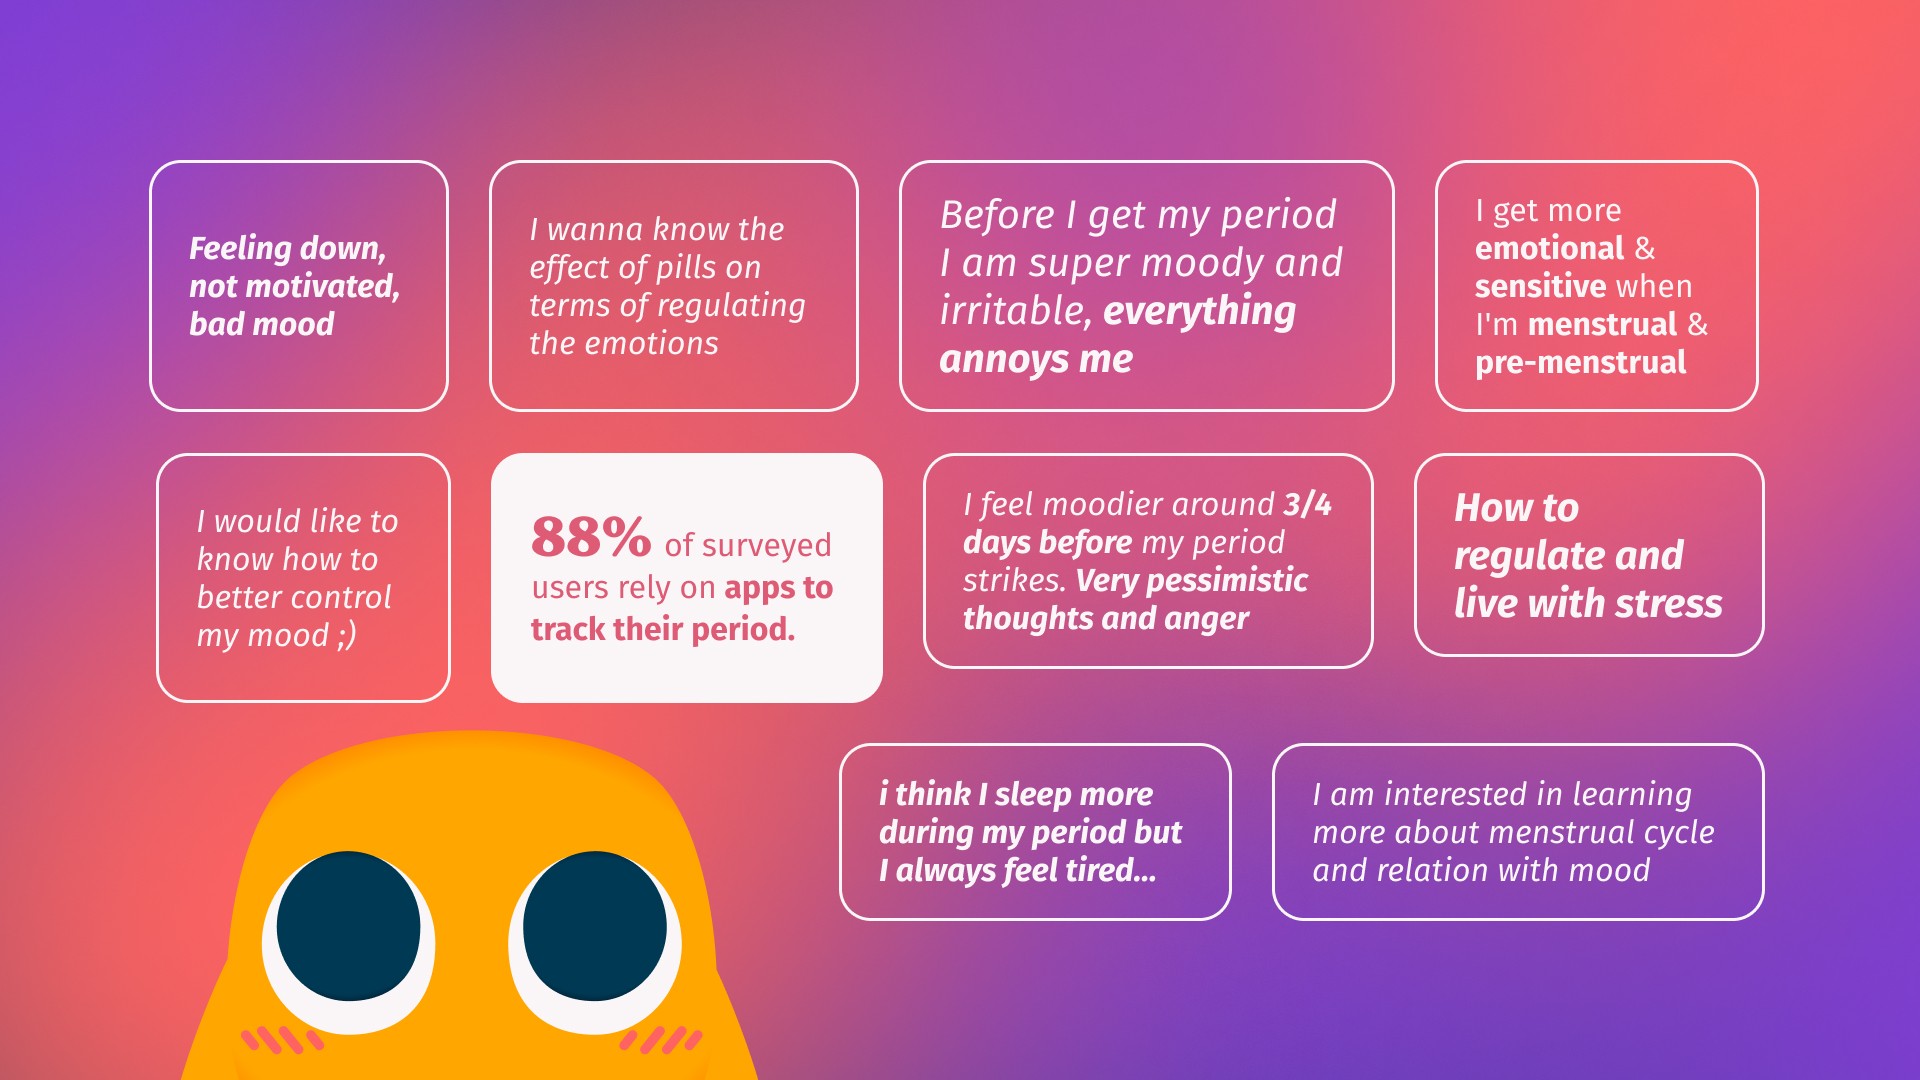
We learned that many people before their period are overall
More emotionally sensitive
Experiencing mood swings, sadness, and irritability.
Interestingly, even with different levels of consistency and regularity, 88% of surveyed users rely on apps to track their menstrual cycle.
Users are generally curious about the link between their menstrual cycle and mood and want to learn more.



Periods tracking apps focus on reproductive health and pregnancy.
Period tracking apps rely on articles as main source of recommendations.
Manual data input, both in period and mood tracking, prevents continuity.
None of the competitors offer daily personalized tips.
Daylio only focuses on mood and journaling.
There isn’t any app that combines mood and period tracking at the same level.
User persona
The emotional enigma
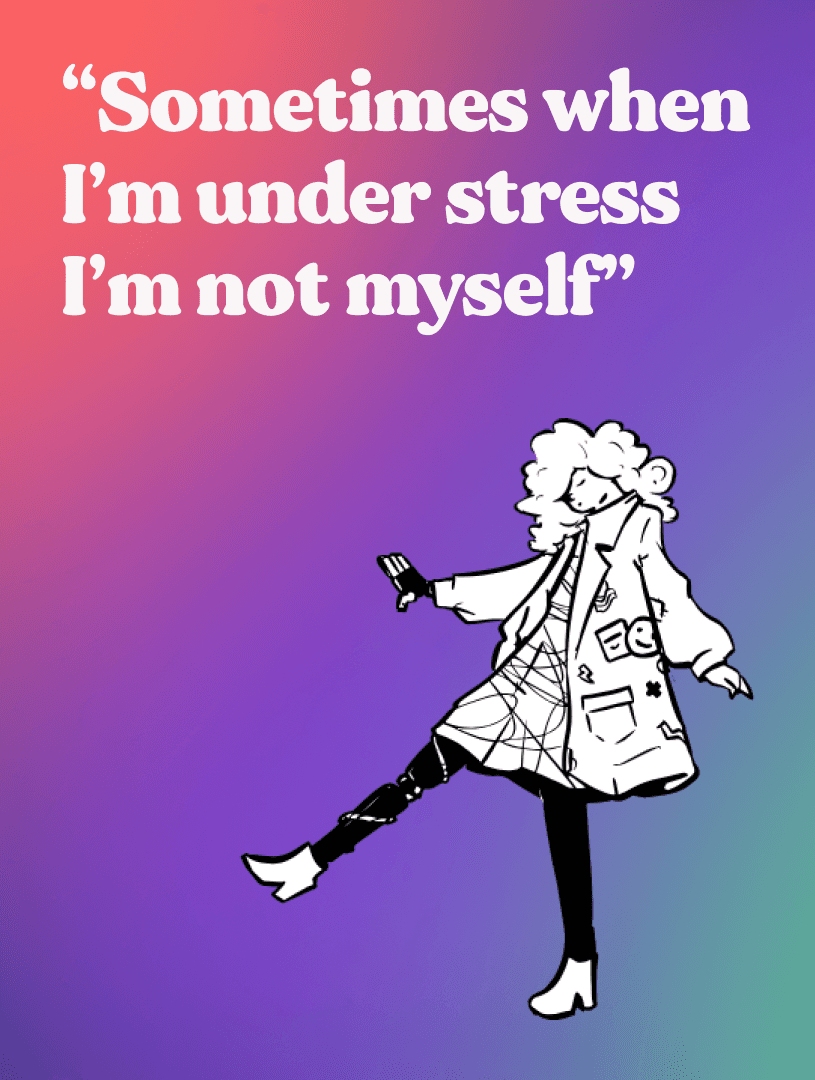
Her main goal is to gain control over her life
She struggles with disrupted sleep due to PMS, and experiences mood swings and pessimism before her period. She also finds it challenging to articulate emotions on some days. Ultimately, she seeks knowledge and tools to navigate these aspects effectively.
Predict PMS & ovulation
Understand hormonal changes
Manage stress
Disrupted sleep
Mood swings
Articulating emotions
Problem statement & Solution
Synced with wearables data.
Predict hormonal and body chemical changes through out menstrual cycle.
Reflects mood based on the tracked data
Visualize emotions to encourage self-compassion and kindness
Main insights
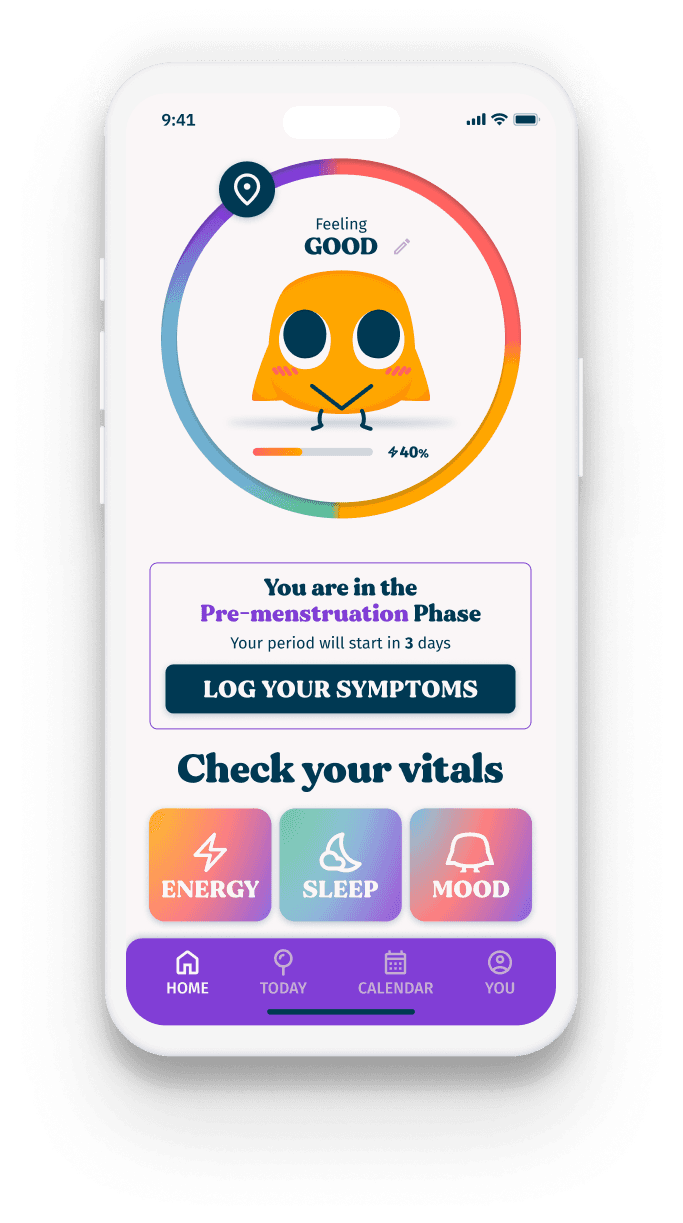
Home screen with digital pet, vitals and symptoms log.
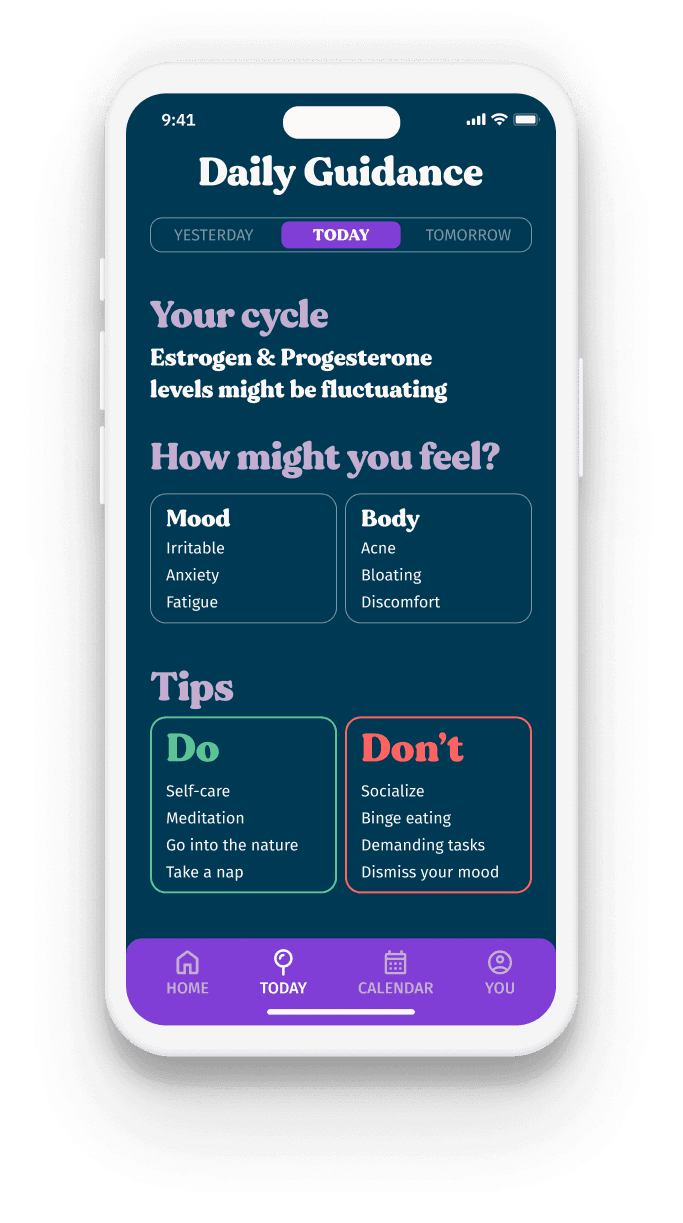
Daily guidance screen with cycle information, what to expect and tips.
Manual input
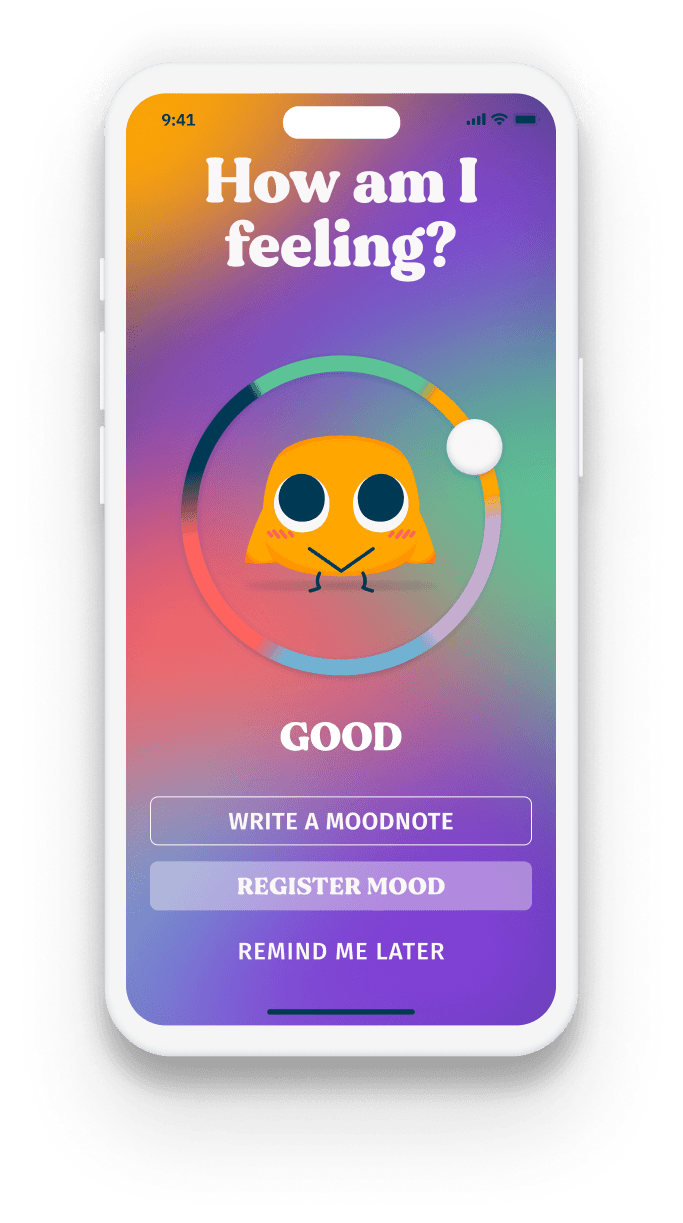
Mood input screen with different emotions and an option to write a reflection on them.
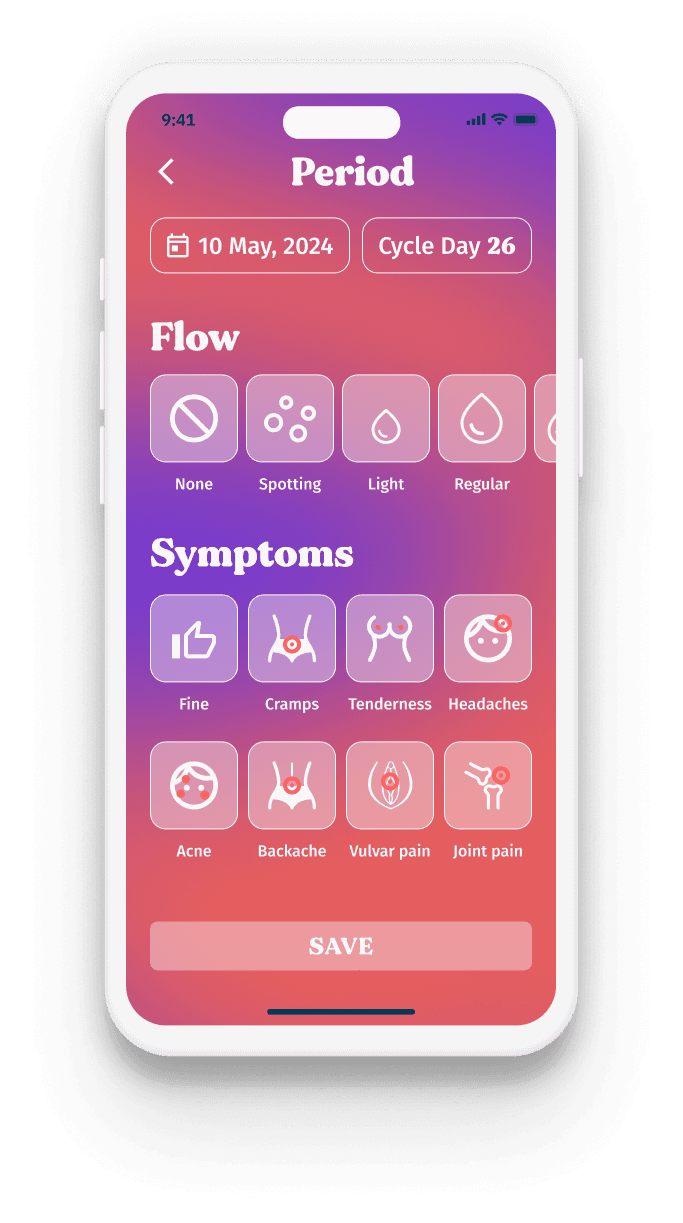
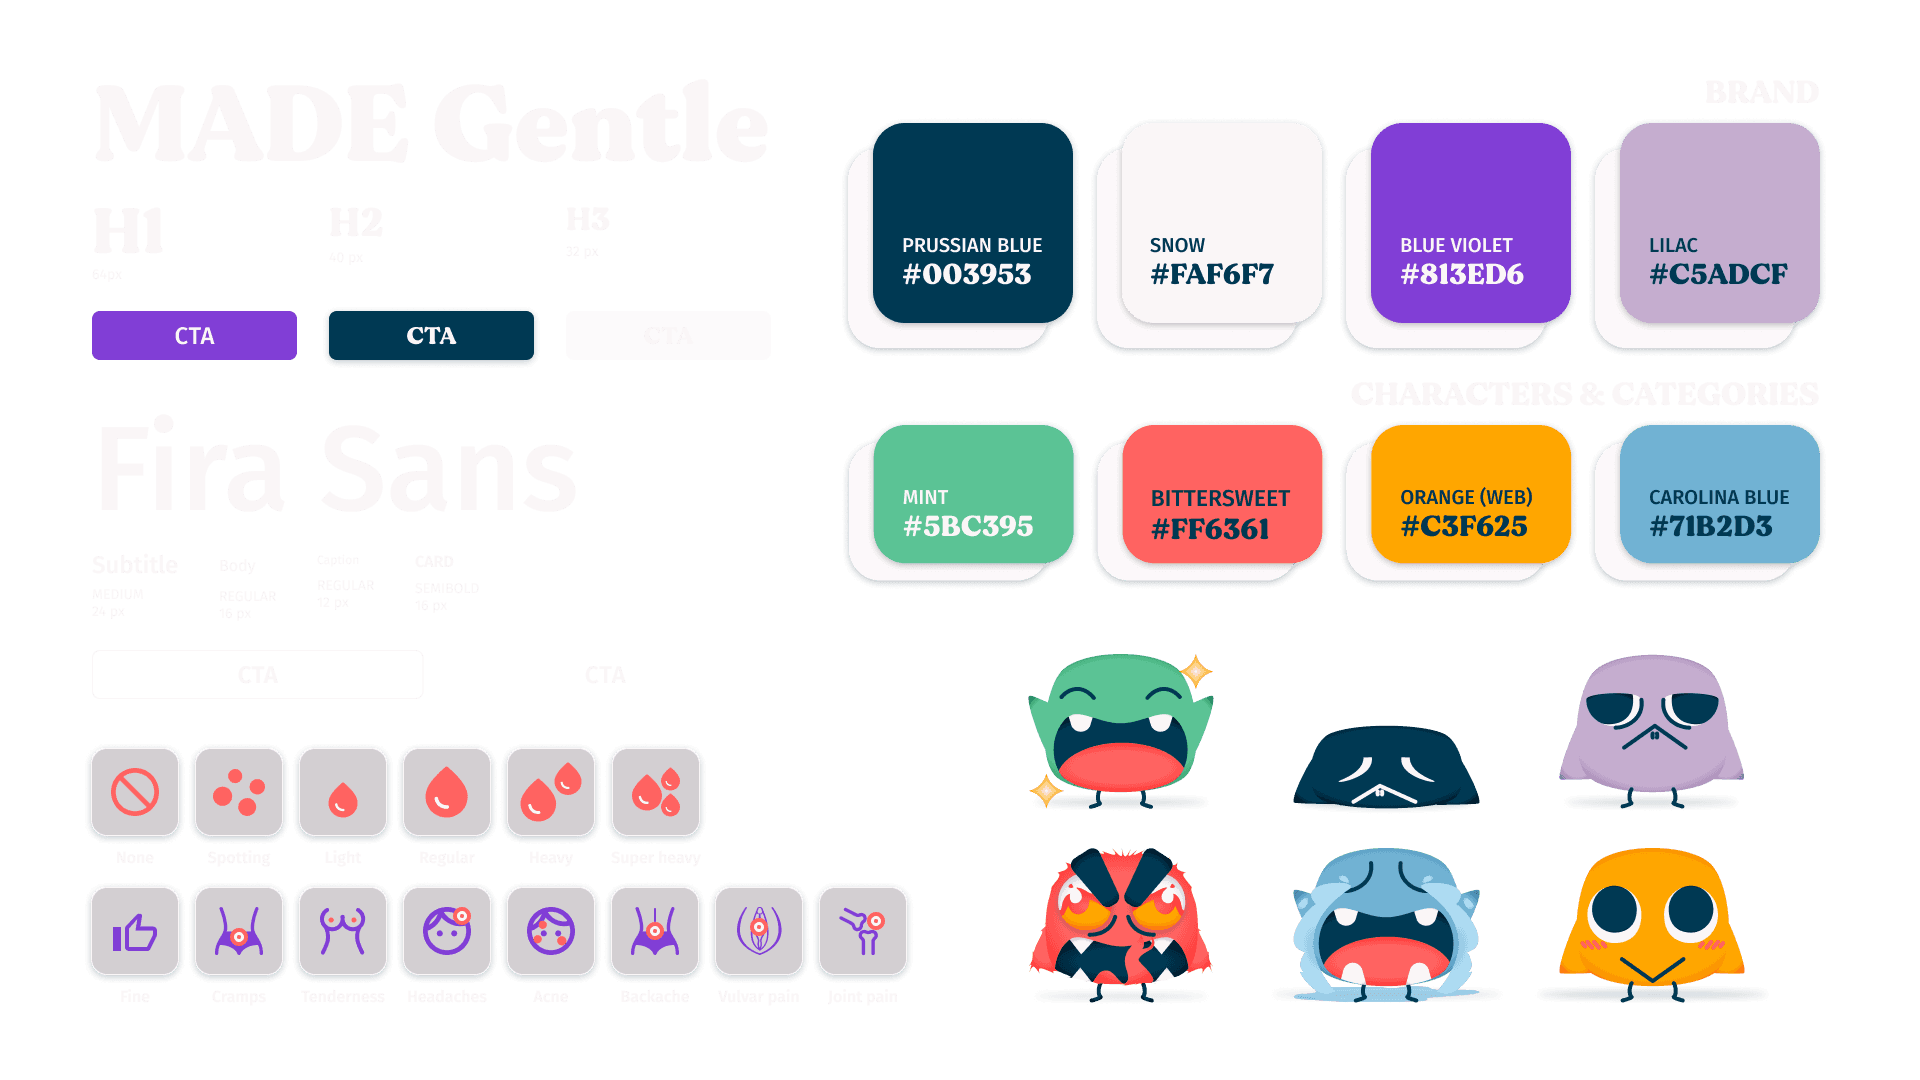
Symtoms screen with different options for flow level and physical symtoms.
Vitals
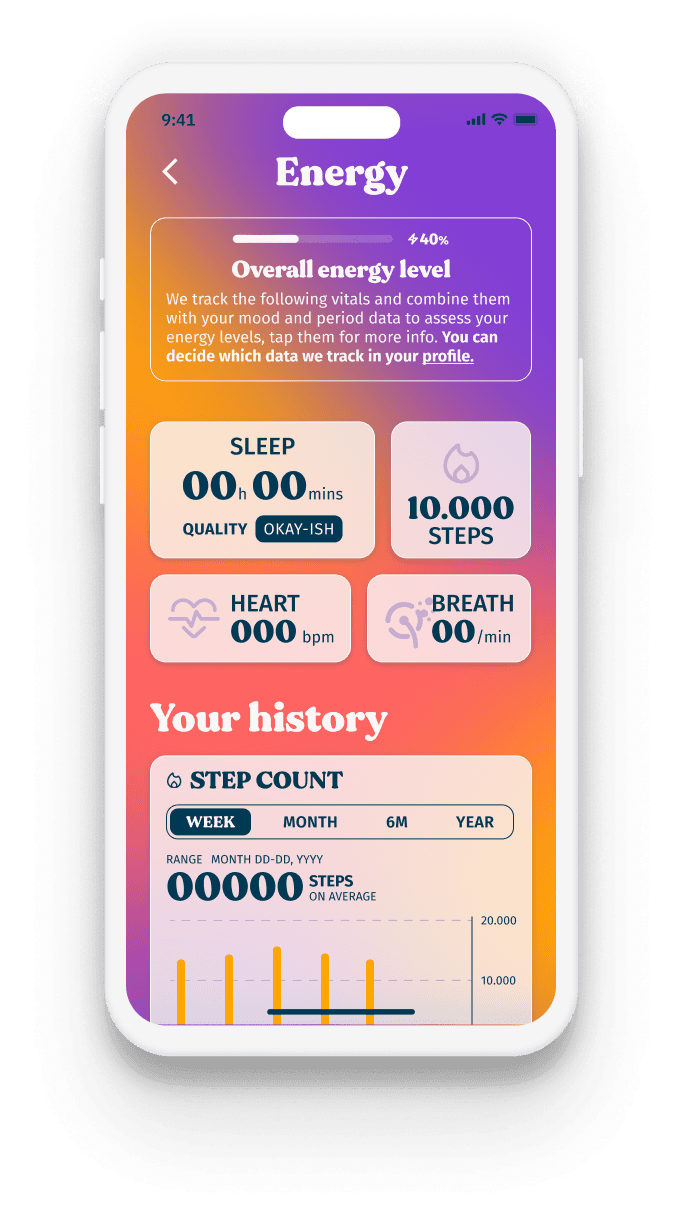
Energy screen that combines information from wereables like sleep, steps, heart and breathing.
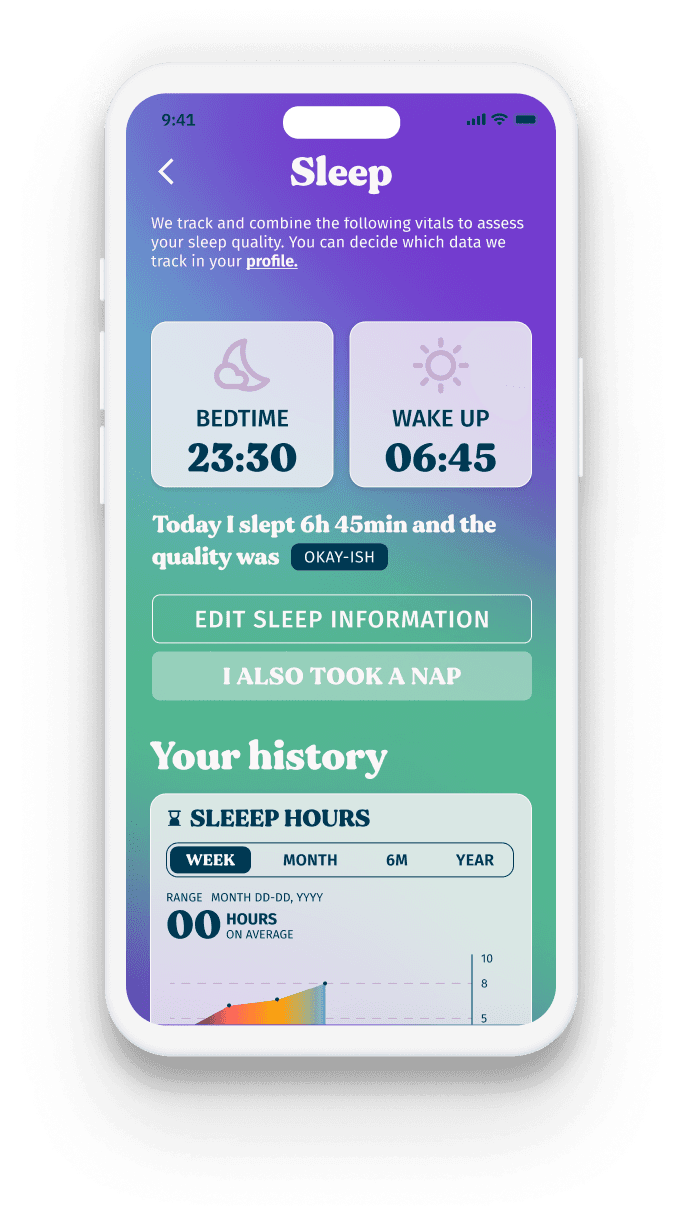
Sleep screen with an overview of sleep time and quality with editing options.
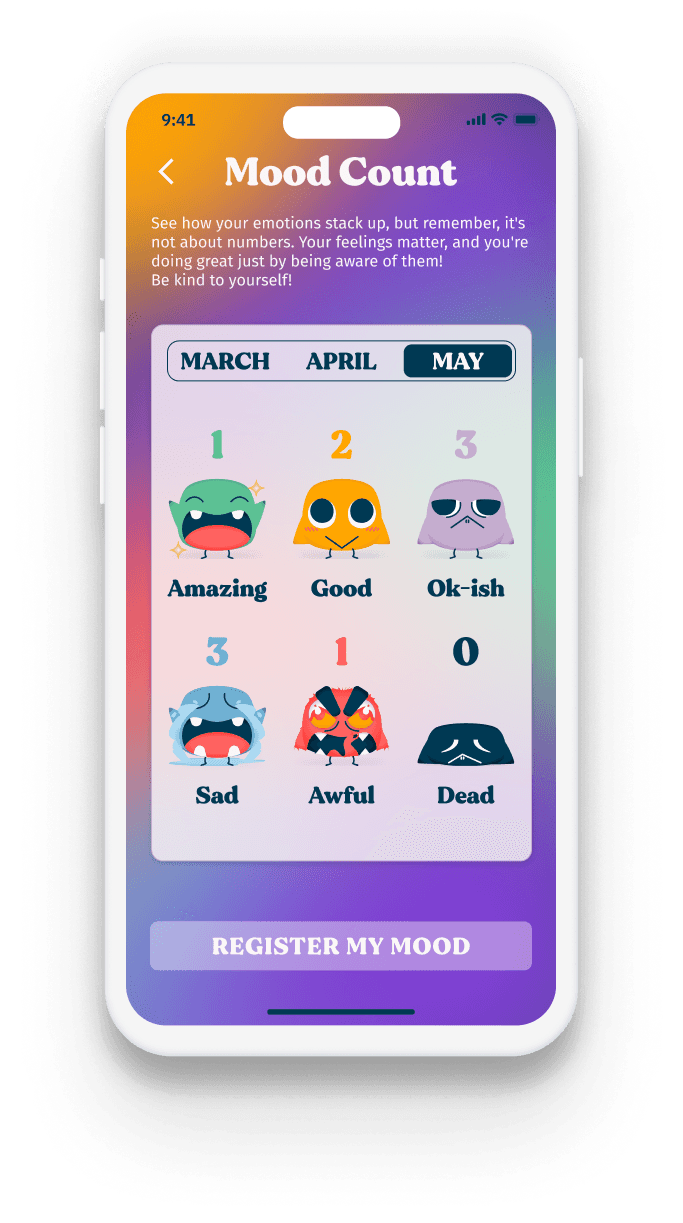
Mood count screen with an overview of tracked moods.
Calendar
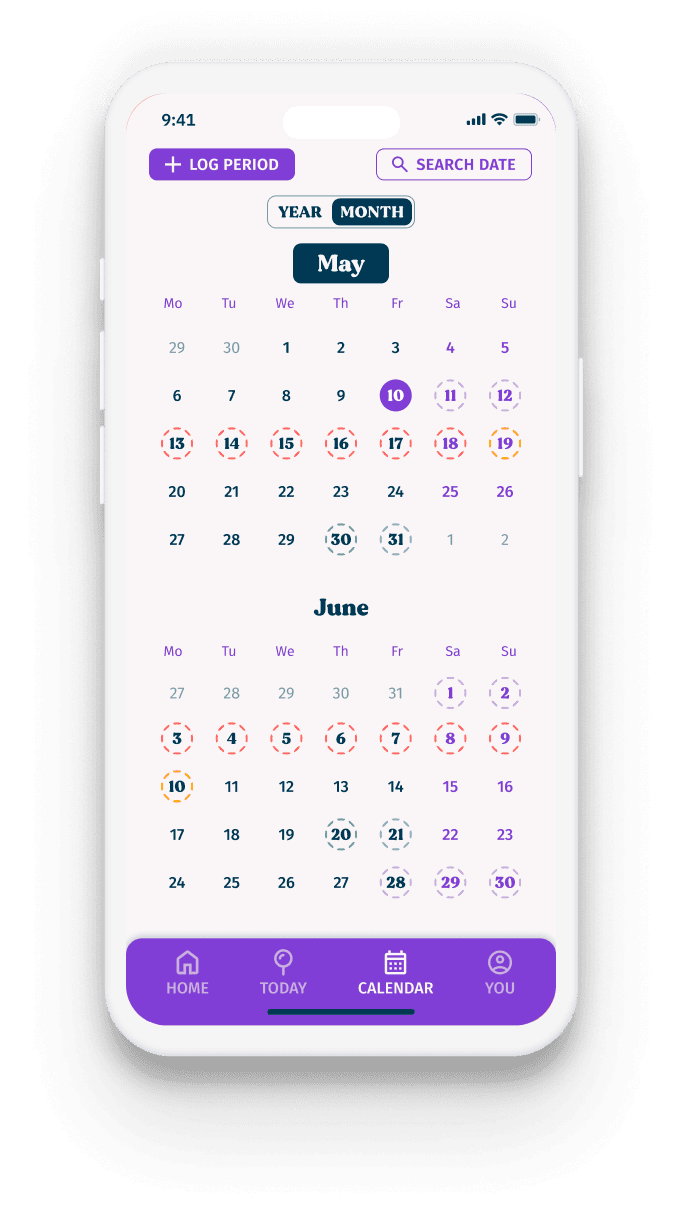
Monthly view screen that shows expected key points in the cycle.
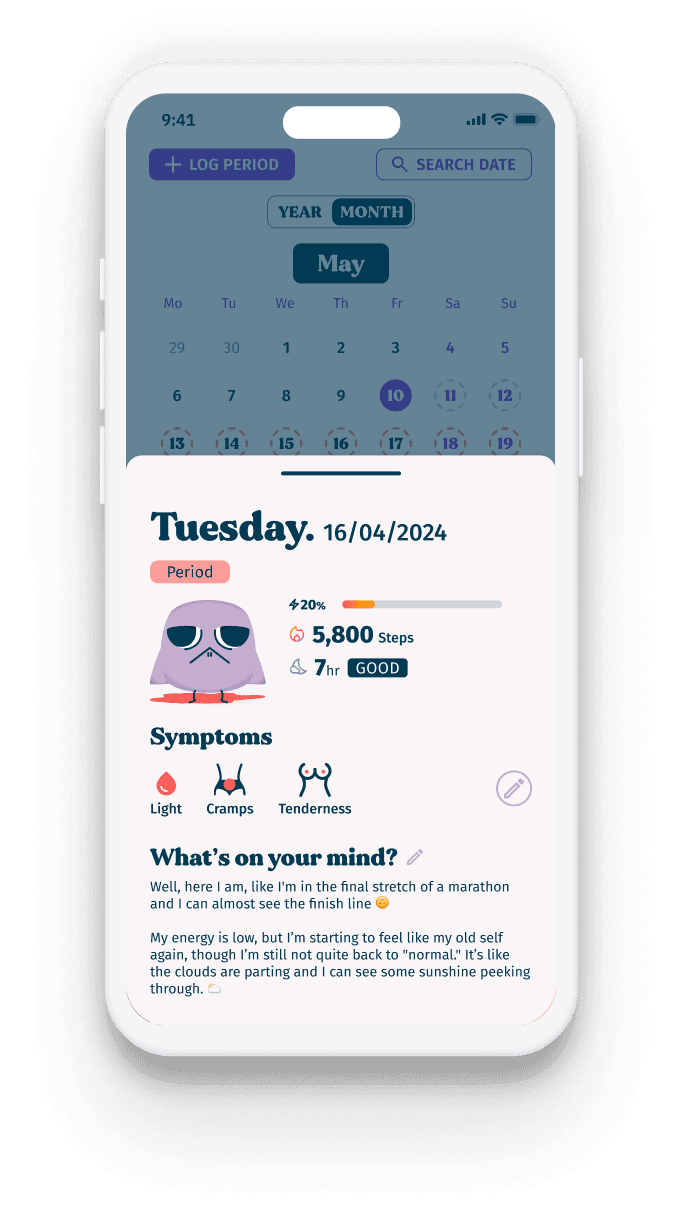
Today view popup with a summary of the tracked information and notes.
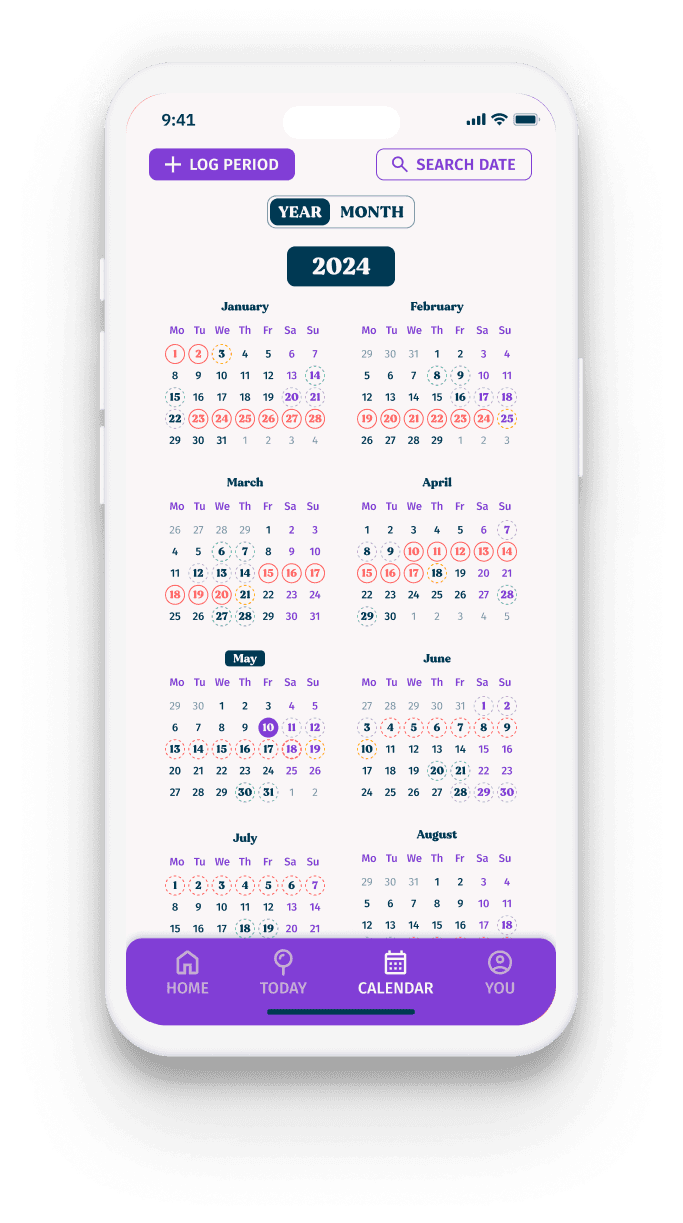
Yearly view screen that shows an overview of the whole year.
Last thoughts
Moody is more than just a period tracking app, it’s a comprehensive wellness tool that empowers users through self-care and data visualization.
Fine tune the existing flows with
Develop remaining user flows
Long term: improve the digital pet with customization options and interactions